


Markets On The Brink?
If you have your retirement parked in traditional 401k, mutual funds, asset allocation funds or index ETFs, you may soon find it at the bottom of a lot of rubble... is this the month?

Everything seemed fine on June 23, 2021 to the residents of the Surfside FL, Champlain South Tower. Then, the unthinkable struck when the tower collapsed after 1 AM the next day. Nature teaches us that physics works very gradually, then all at once. Markets can work the same.

Parking your wealth, savings and retirements in seemingly secure index funds may be just as prudent as storing it in the trunk of a car parked in the garage of this South Florida condominium.

Step 1 - Examine the Fundamentals
The top 10 most popular stocks held in broad market index funds makes up over half of the total NAV. This means, every payday, a very large percentage of retirement capital goes to buy the same 10 stocks. What harm could that cause right?
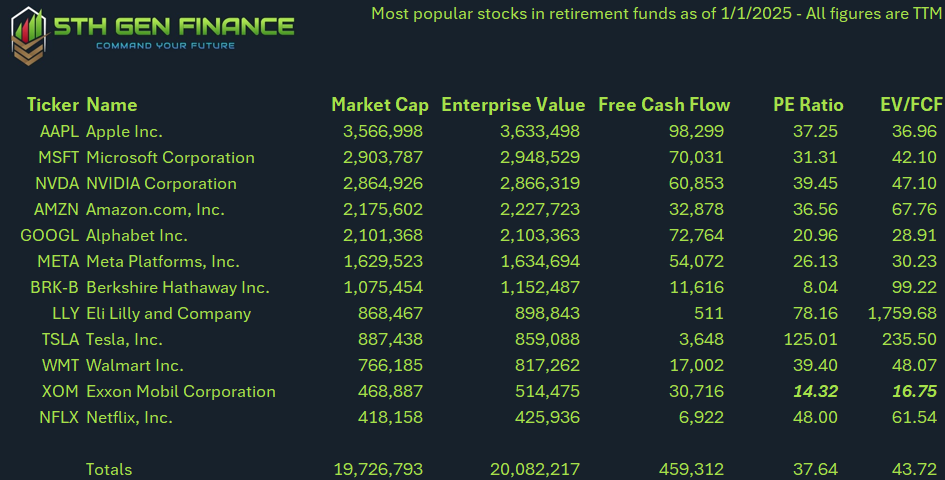
Fig1 below shows the PE ratio and EV/CF ratio for the largest companies on the US markets. While PE ratio is often referenced, companies juice their PE by repurchasing shares with borrow money. This behavior is not hidden the EV/CF metric.
EV = Enterprise Value = Market Cap + Debt - Cash
Given this knowledge we observe a few things:
the total EV and Market Cap of 12 stocks is 20 trillion dollars
the aggregate PE ratio is nearly 38 and EV/CF nearly 44. This means the payback period of owning the stock is nearly 44 years!
XOM and energy are still relatively cheap
15-20 is considered a reasonable to high level for long term EV/CF.
We are due for a 10-12 trillion dollar correction in the major stocks alone!
Conclusion: Stocks are “Nordstrom Pyrite plated rims” kind of expensive. You should be thinking about how to avoid them. More to come on that.
I generated a DCF valuation for the names above. None of them project favorably. It seems analysts have an unrealistically high expectation for the growth rate of tech and still a fairly mundane one for the growth rate of conventional hydrocarbons.
Step 2 - Examine Technical Catalysts
In this section I will refer to market stages. For more details, you can refer to the stage analysis market model:

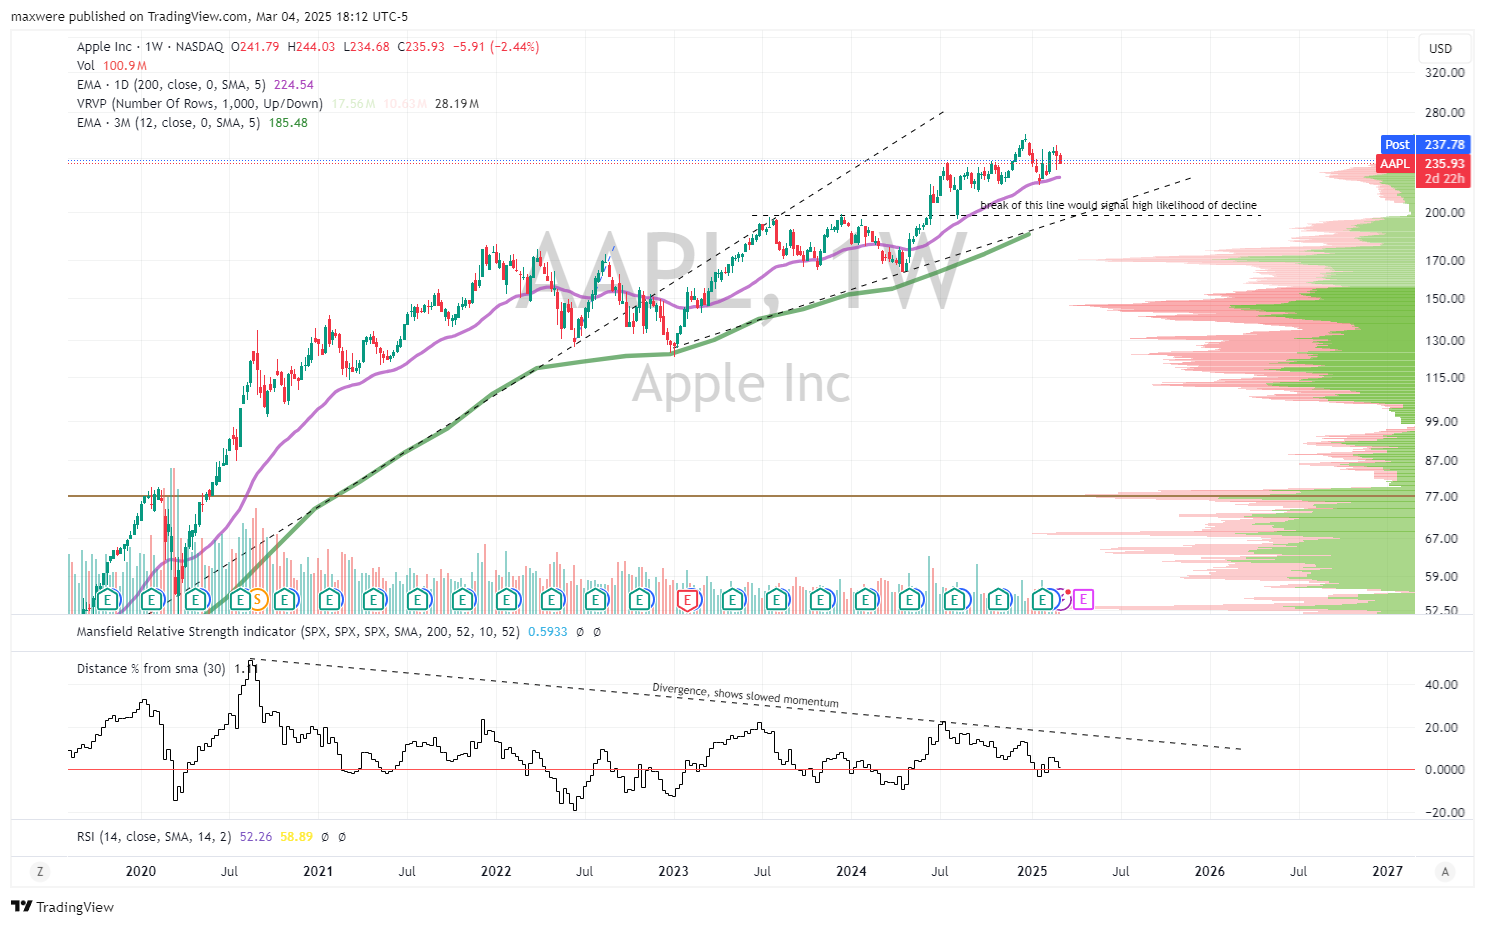
AAPL - stock is still in late stage 2 as is was able to break above the resistance at 200 last year. I clear break below that would initiate a clear top or head and shoulders look. At the current moment this stock doesn’t look to be at severe technical risk of breaking down.
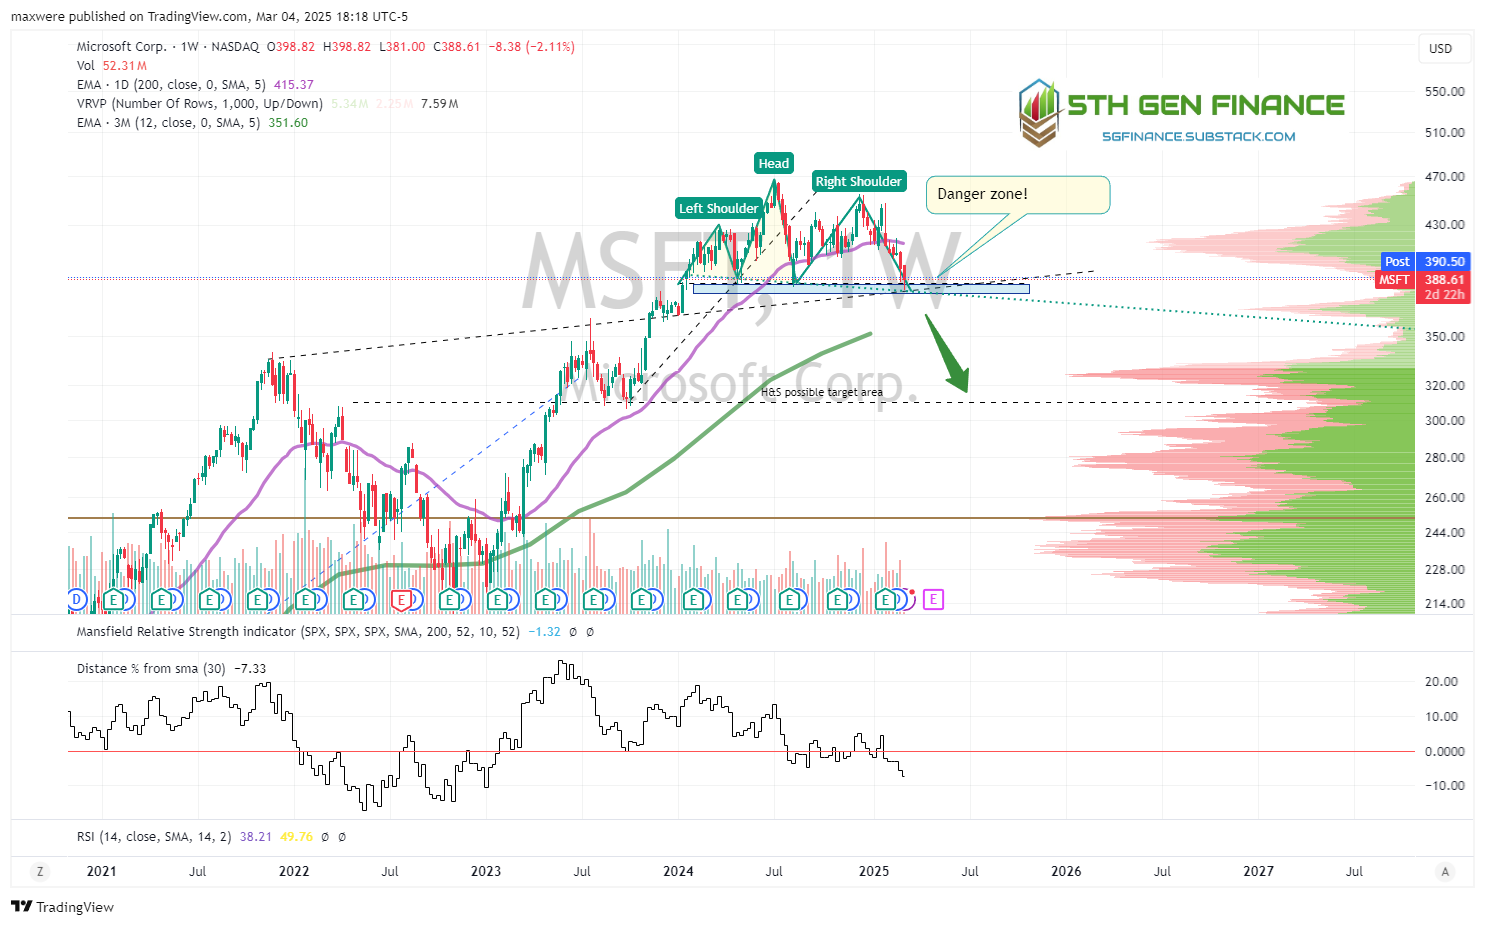
MSFT - on the cusp of a H&S top. This is a very tenuous zone here. If this is triggered in the next week or two, it likely translates to a fairly quick 20% selloff. Not the end of the world, but a significant data point.
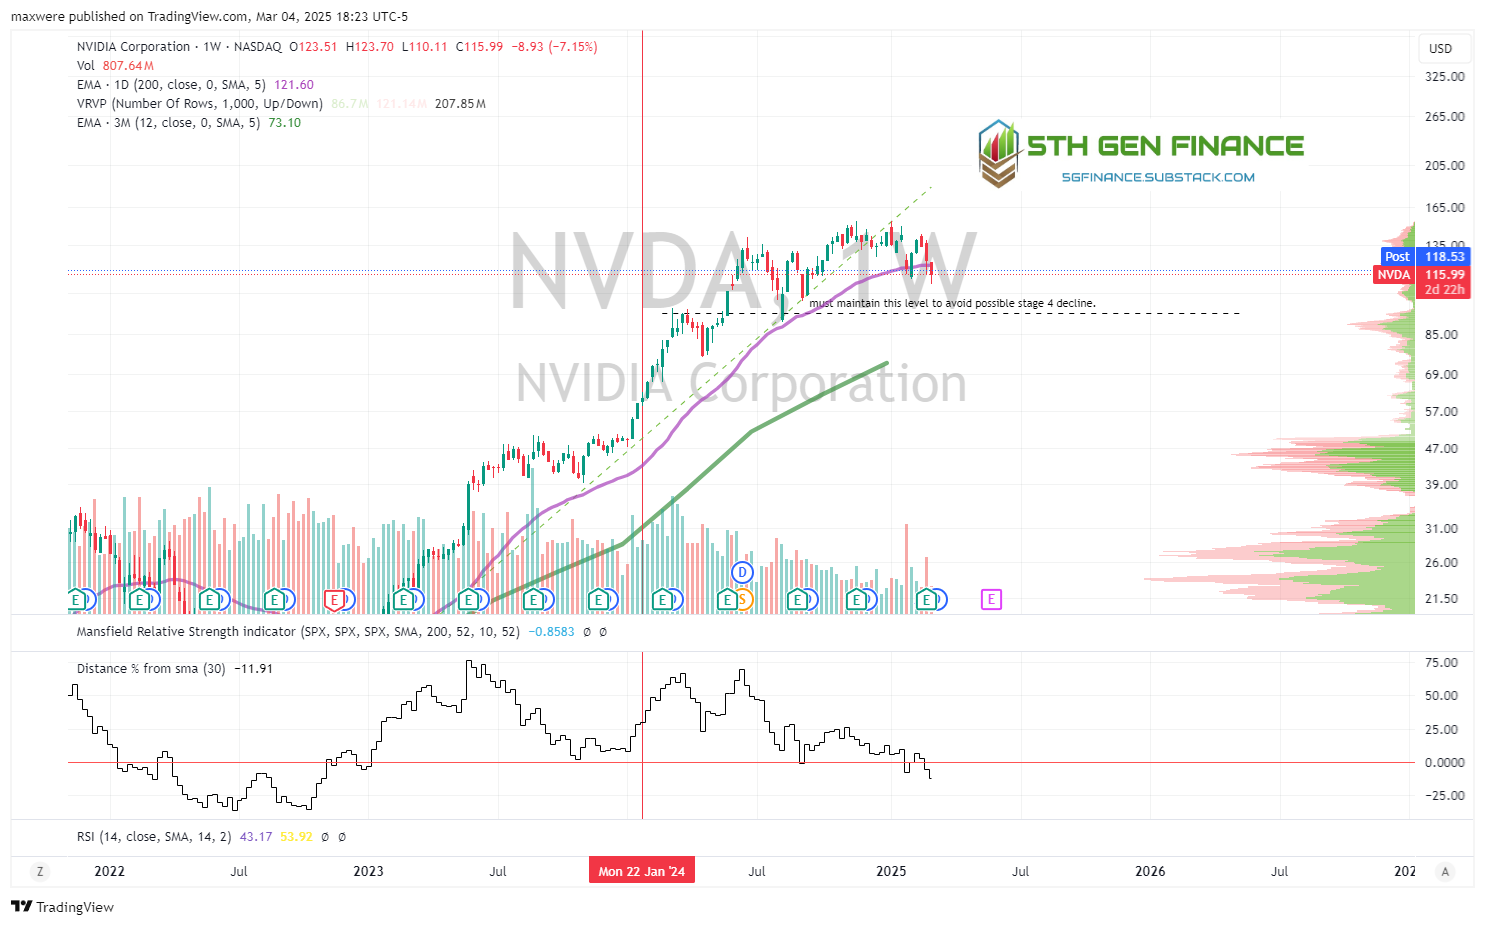
NVDA - looks like stage 3 for now. It must stay above the $95 area to avoid major fall.
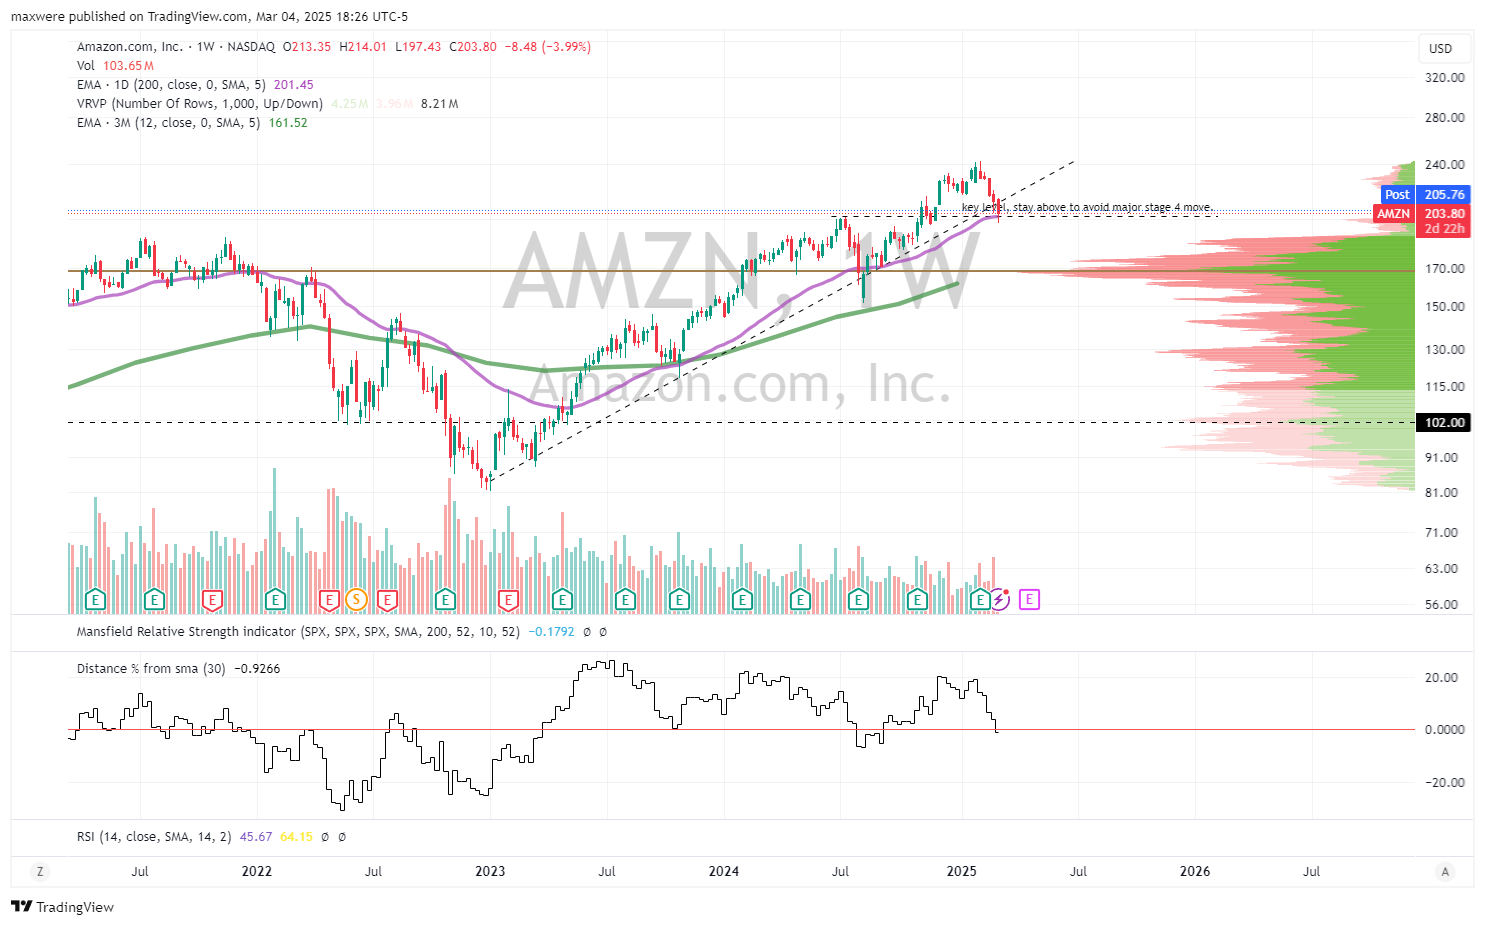
AMZN - simple chart. A battered end of this week and AMZN can lose its trend and enter stage 4. The target for that stage 4 decline is roughly -40%.
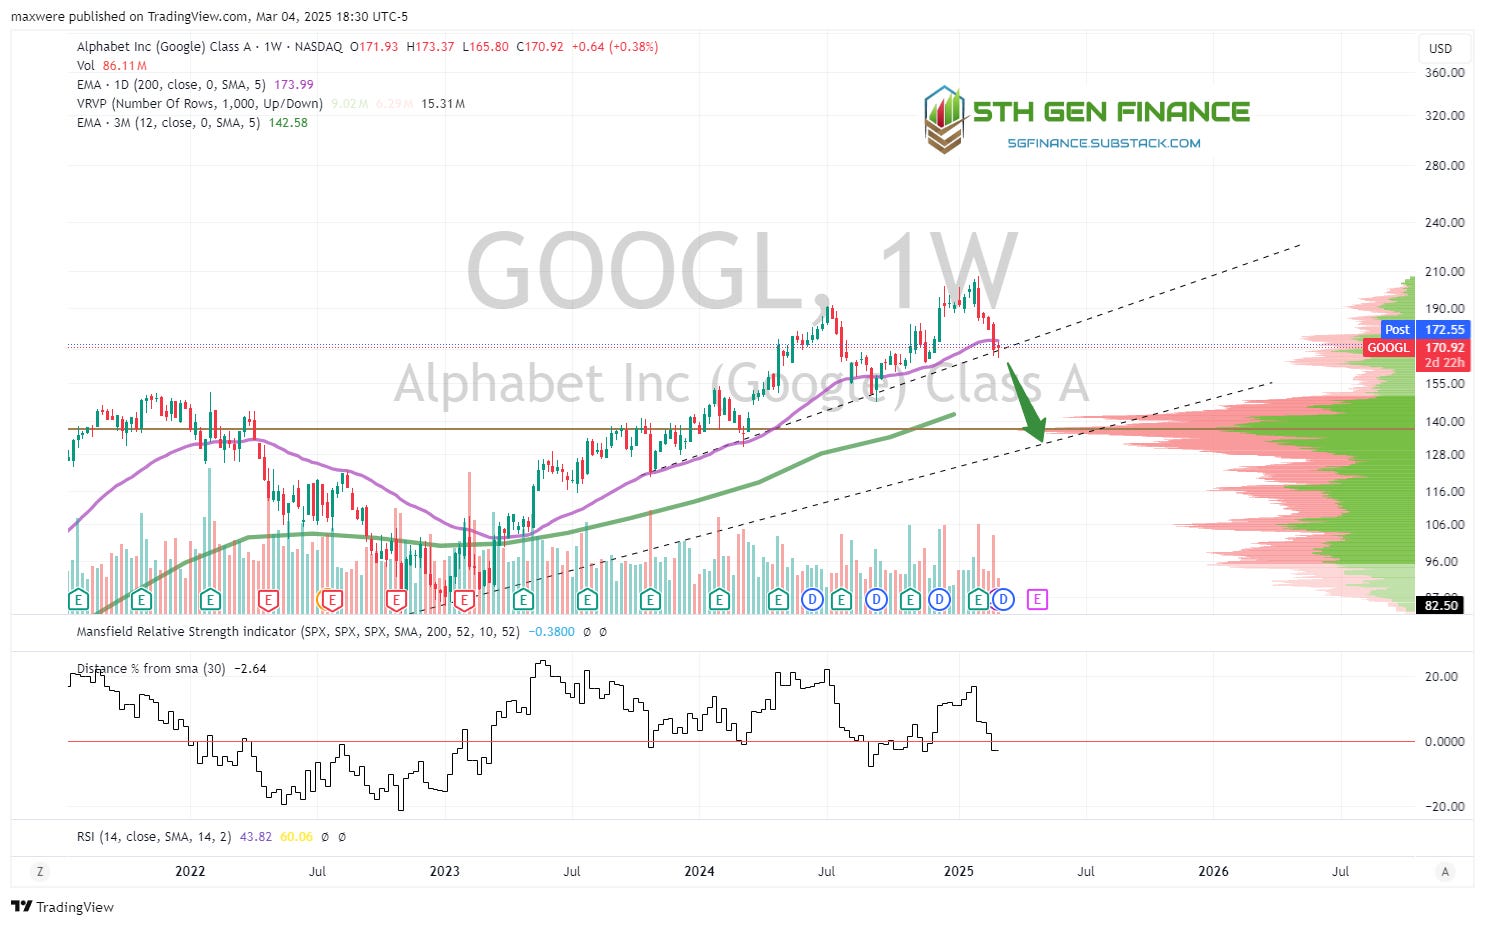
GOOGL - nearly the same as AMZN. The loss of the trend line threatens to lose a quick 20%.
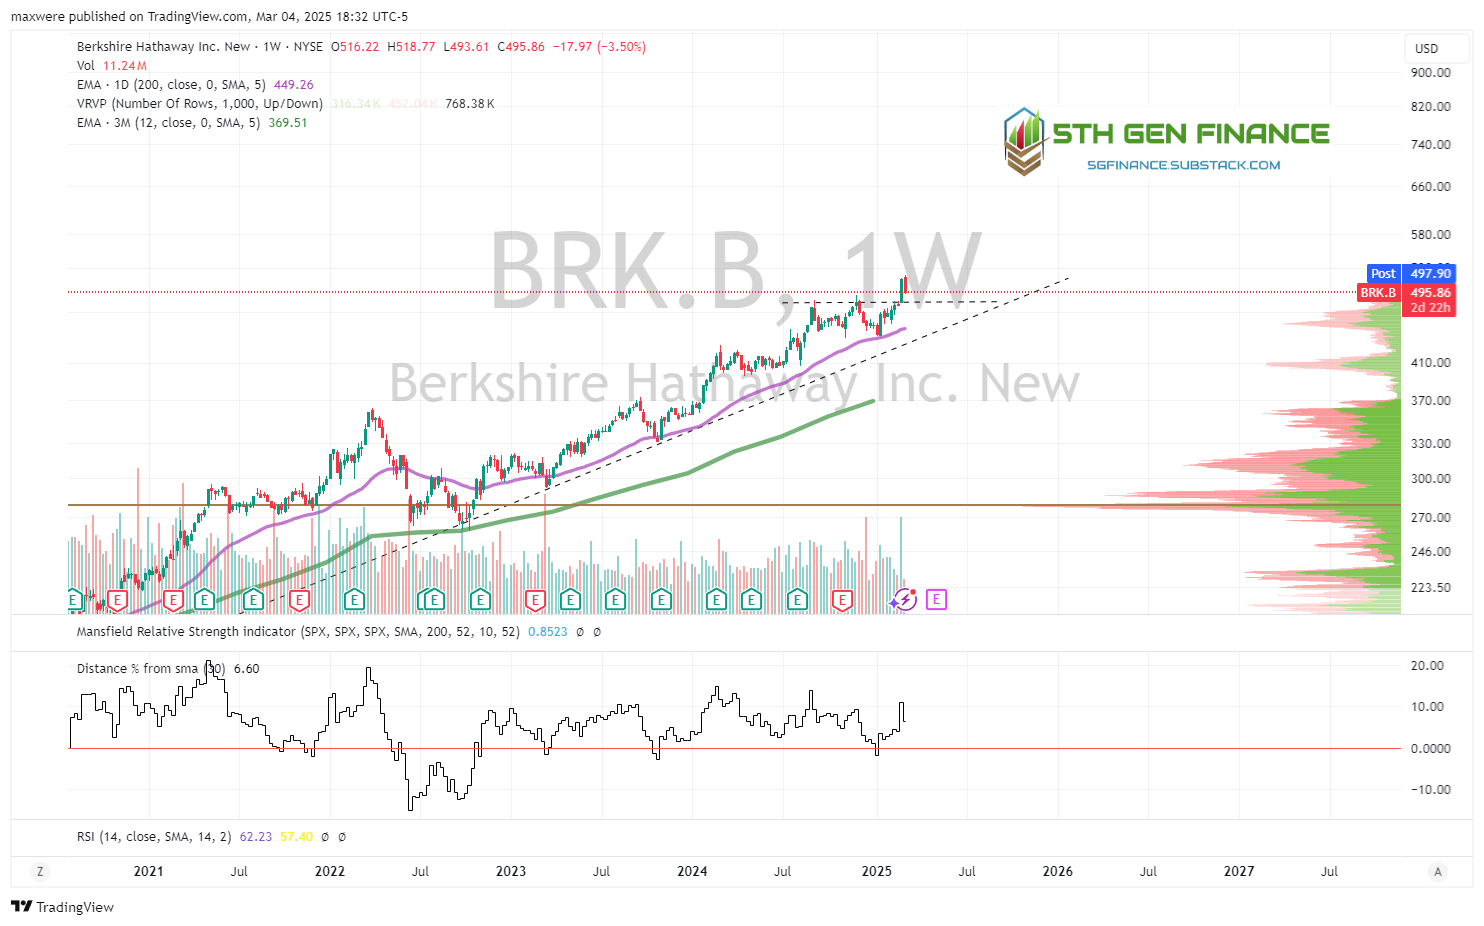
BRK.B - strongly in stage 2 uptrend. Looks quite bullish. Broke out last week. This one is strong for now!
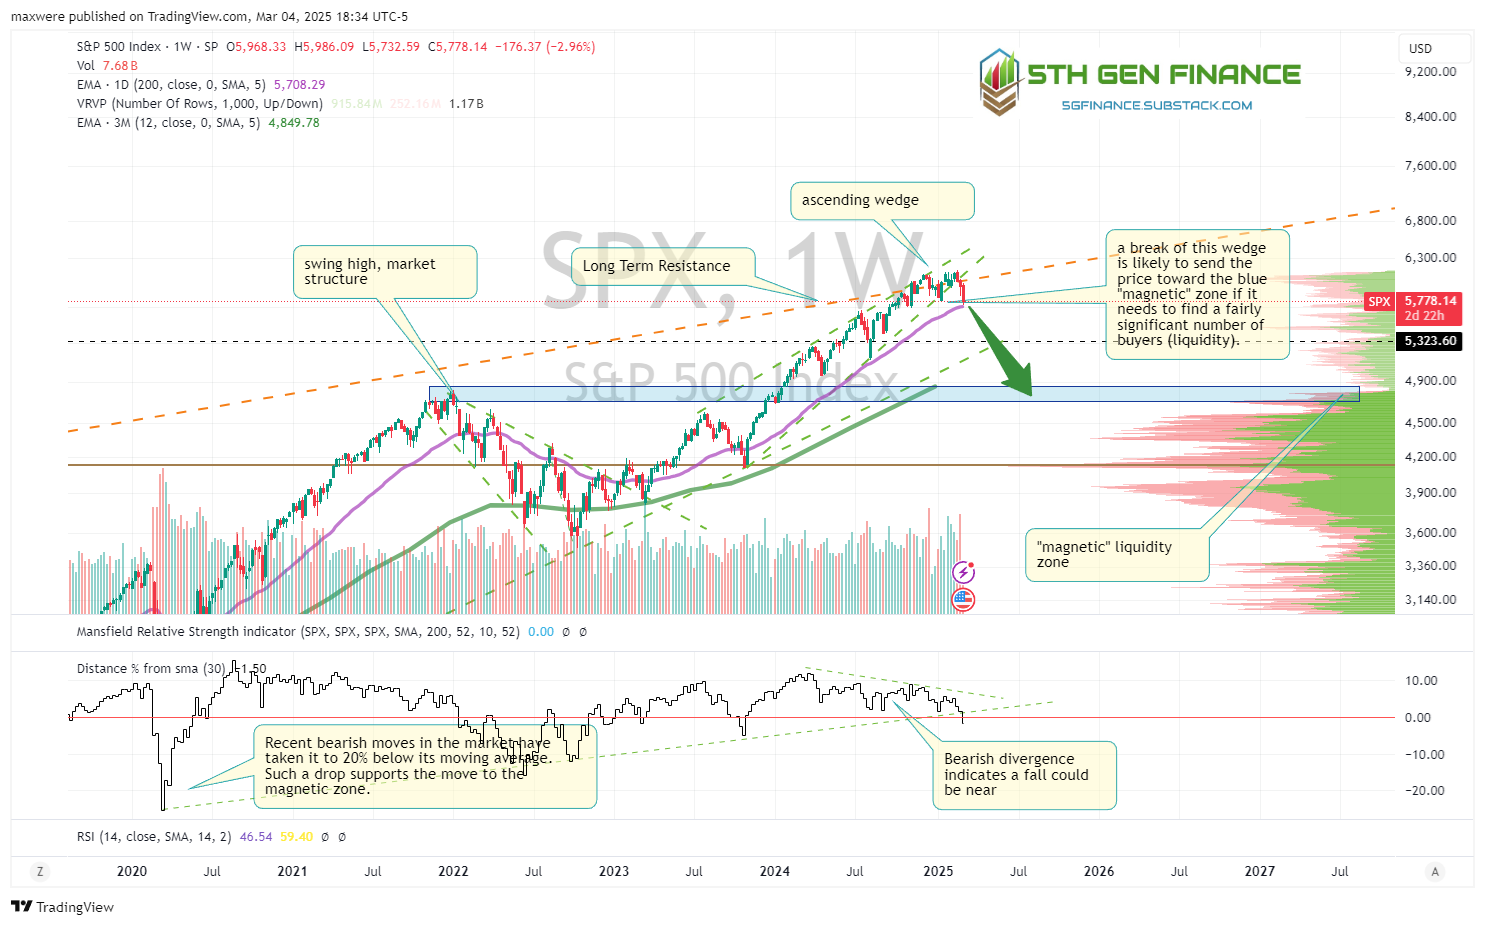
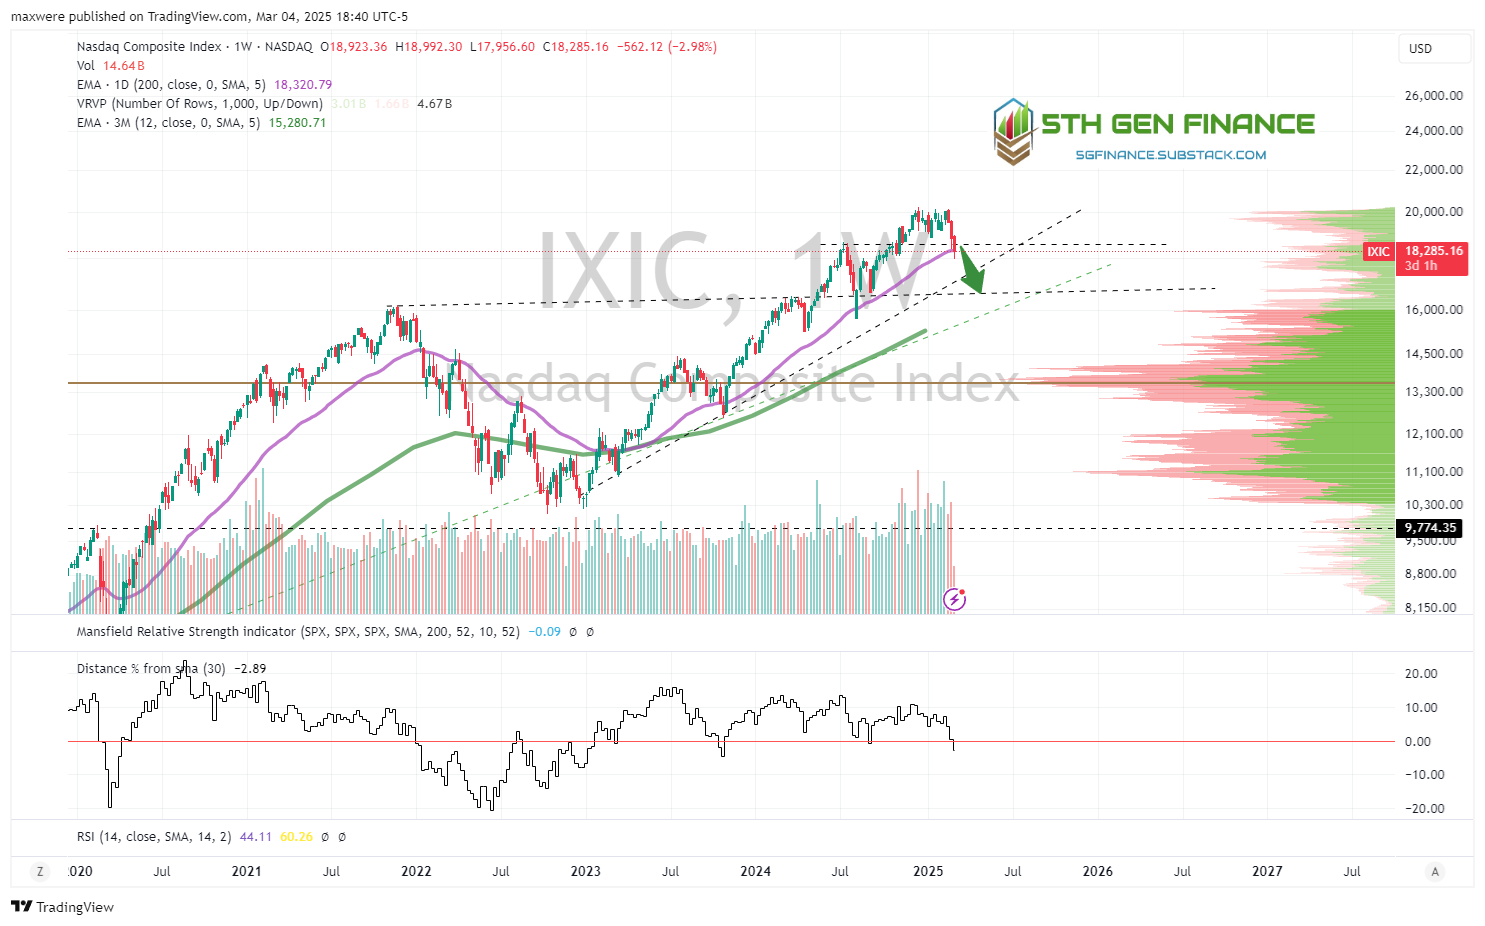
SPX index - Rising wedge is broken to the downside. A 10% correction seems immanent. -20% will be challenged here. This may not necessarily morph into a major market correction (-50%), but something to keep an eye on.
NASDAQ - similar to SPX. A short term correction seems likely.
Technical Conclusion - There is general short term bearishness. It stands to let that play out and see if it leads to a wider selloff. Professional traders can make money on these trades but overall these charts don’t signal a lot of value for the patient investor.
Is a major stage 4 move on the horizon? Short answer is, it doesn’t look like it. A short term correction of 20% (+/-) seems more likely. That could morph into something severe, but I’m not sure the clock reads 11:59 PM here… YET.
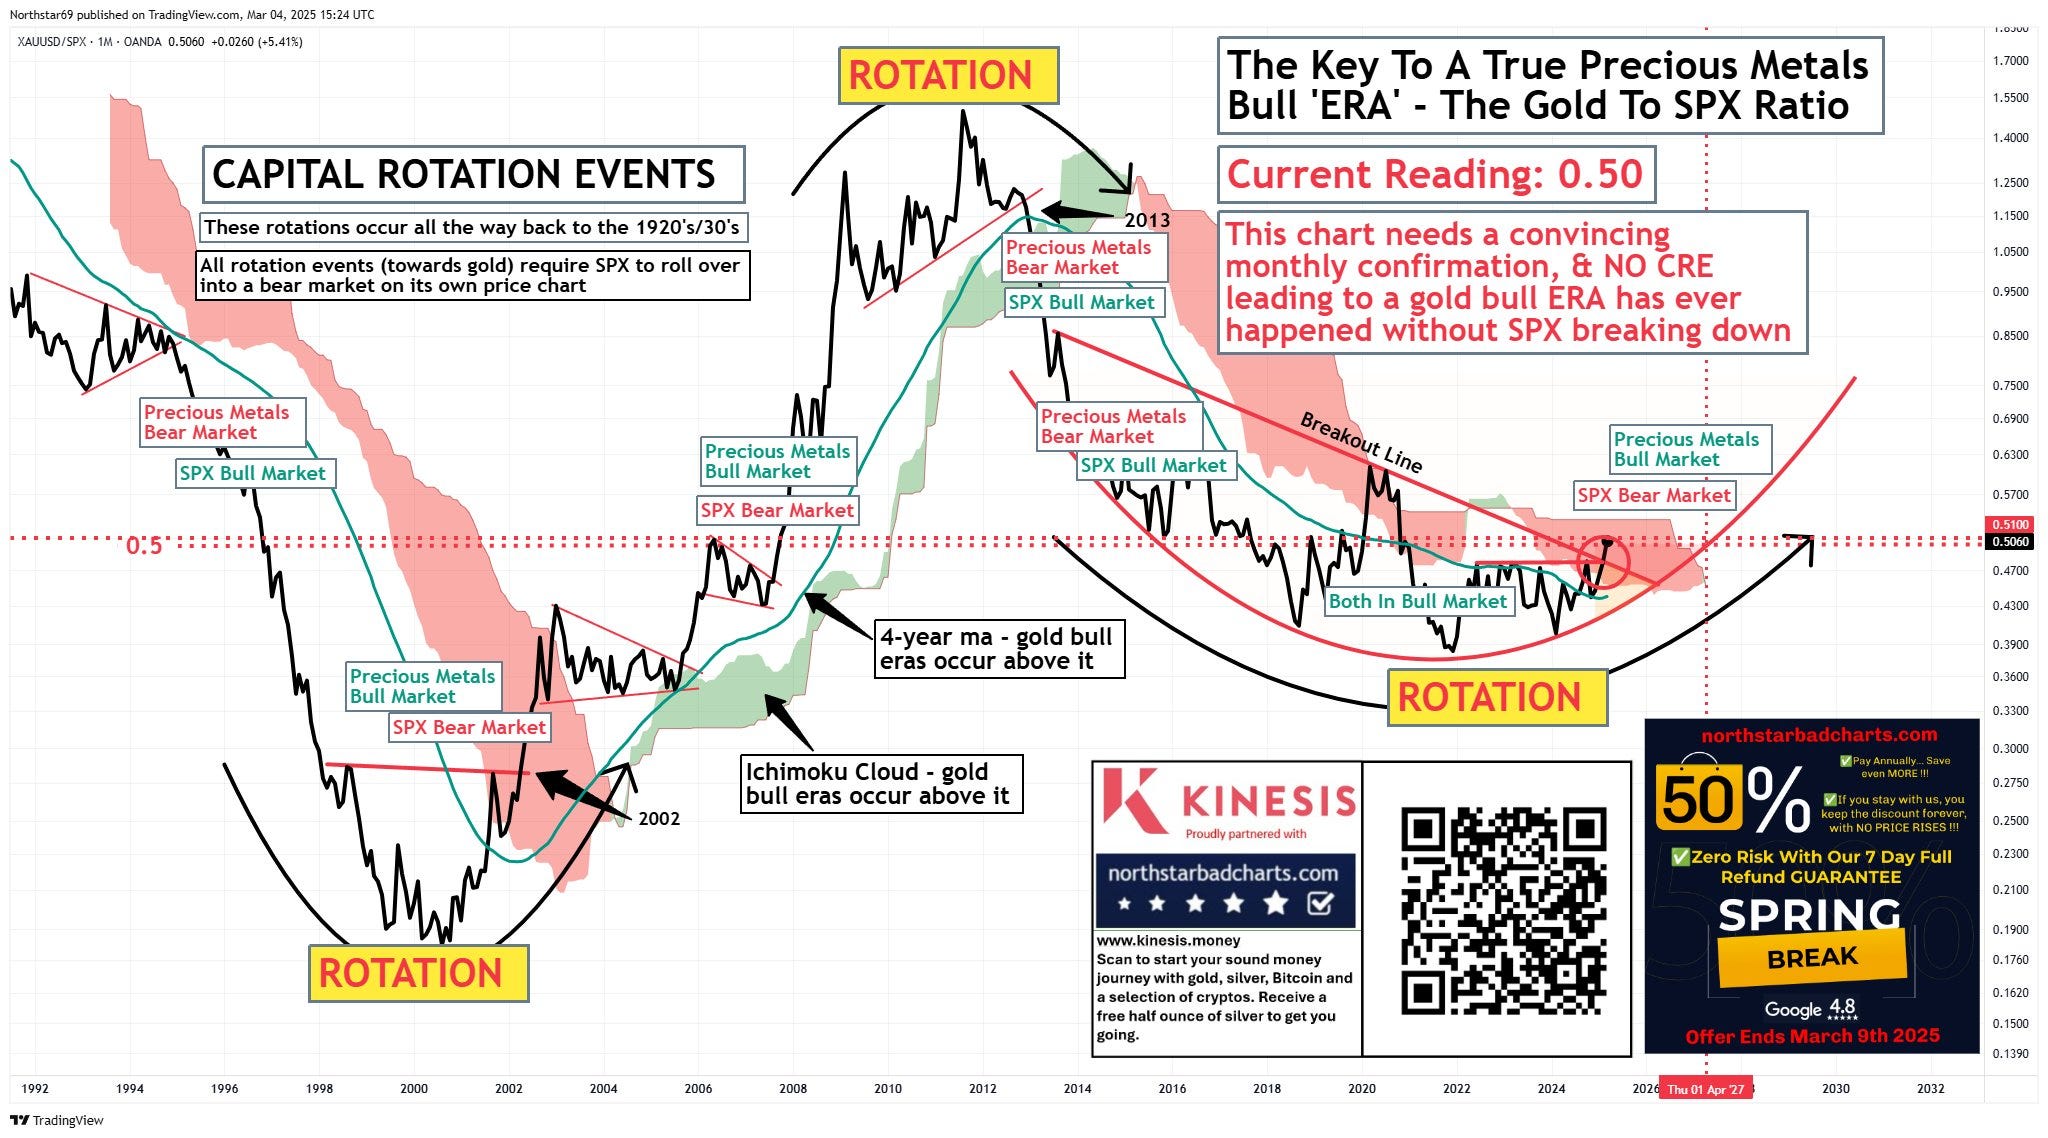
TBC… later this week we zoom out, look at market ratios and capital rotation event described here by Kevin Wadsworth.
**Disclaimer:**
The information and outputs provided by this 5th generation finance model are for informational purposes only and should not be considered financial advice. While the model utilizes advanced techniques, financial markets are inherently complex and subject to unpredictable changes. Following the model's recommendations does not guarantee positive financial outcomes, and there is a possibility of financial loss.
**Important:**
* Options trading carries a high risk of loss of capital. Trade at your own risk
* It is crucial to conduct your own independent research and due diligence before making any financial decisions.
* Consider seeking professional financial advice tailored to your specific circumstances.
* You are solely responsible for the investment decisions you make and the associated risks.
Could energy/XLE have one more flush ahead before it is a more compelling buy? Some of the individual names are beginning to waterfall down...APA COP MUR etc