The Stage Analysis Market Model
This is a high time frame technical analysis model that I use to guide entries and exits in term of market timing.
Technical analysis is actually the linguistic behavior of market participation. Like all language, it requires proper interpretation within its context of delivery. Simply put, an active “listener”. The TA model presented here is a verifiable pattern of human behavior, that is by no means guaranteed, but of high enough profitability to earn a handsome reward over a myriad of attempts.
This model is considered TA (technical analysis). Although, I would point out, its cousin (FA) is also technical in nature. Market technicians will claim that price is never biased and essentially the same across all charts and industries. They are correct, but the better reason is, there is just a lot more data about how the market participants are bidding.
TA and FA are both technological systems inside a technological society. They both “work” because they are technical and recognized that way. Put more simply, they work because they are the language of technicians.
In its simplest form, market price only does 3 things on a given time scale:
It goes up - more buyers than sellers
It goes down - more sellers than buyers
It goes sideways - roughly the same amount of sellers as buyers
That being said, chart patterns aren’t always clear. Sometimes up and side ways can be muddled by chaos. If you have chaos in your chart, back out to a higher time frame. (eg. if you are viewing a chart on a daily candlestick, back out to a weekly one and so forth). For the purposes of this market model, its intention is to be viewed on a weekly or monthly candle time frame.
Four Stages of “Stage Analysis”
Stage analysis as 4 stages:
Accumulation (sideways)
Advance (up)
Distribution (sideways)
Decline (down)
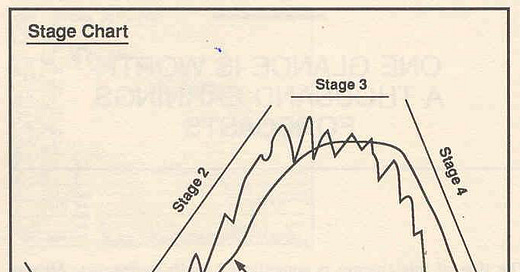
The textbook image looks like the following:
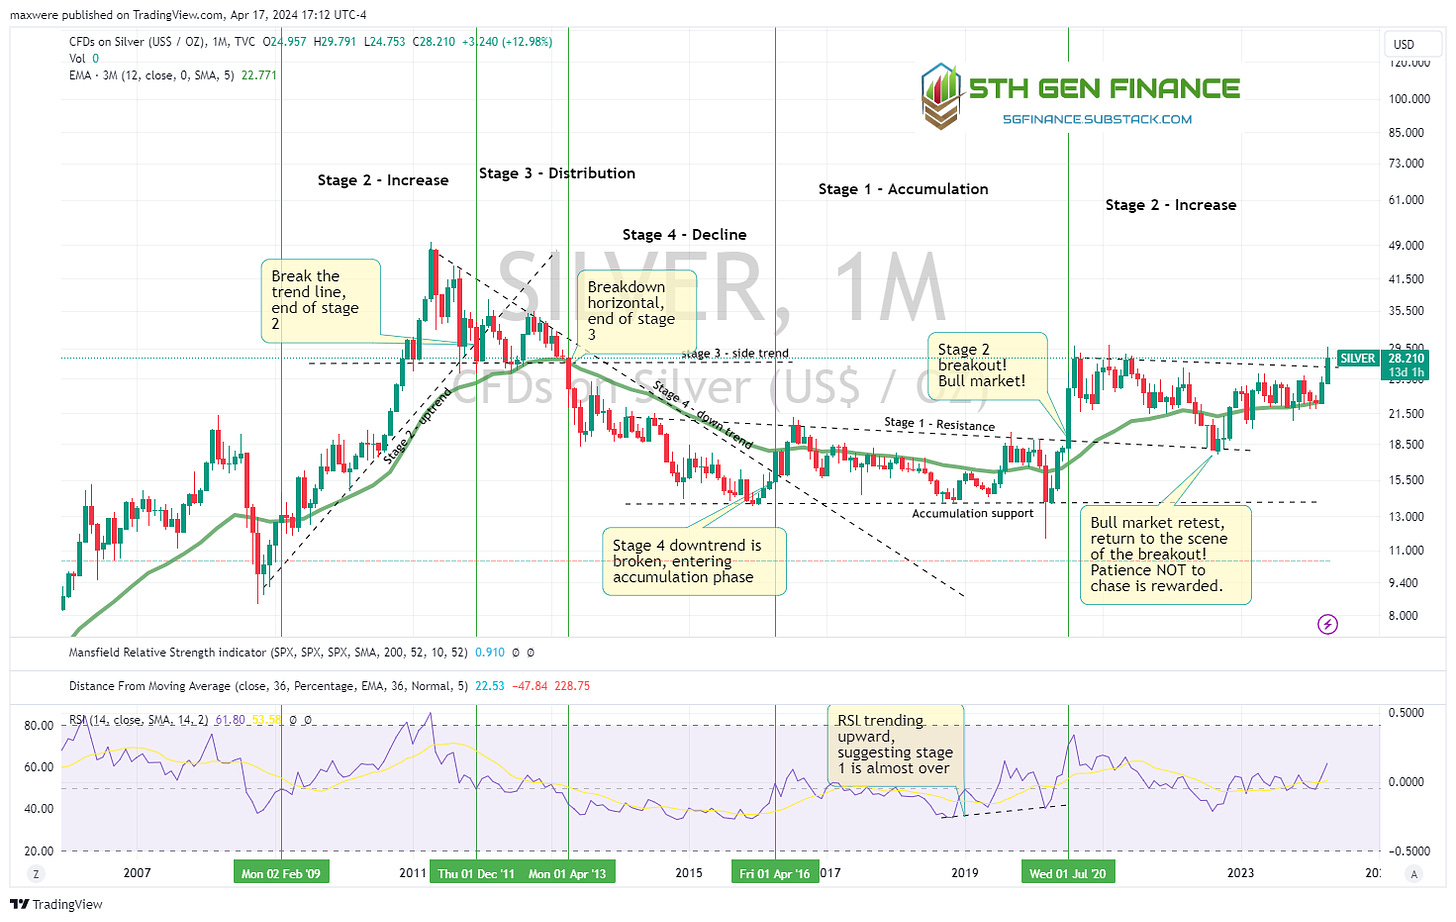
Simple enough, right? Now lets look at the recent silver chart with some annotations identifying the stages.
A few notes…
generally stage 3 is shorter than stage 1. Stage 3 is the location Walter uses to unload his large portfolio. This takes time and PR (read: propaganda relations).
stage 4 is generally much steeper than stage 2. The old adage is: “you take the stairs up and the escalator on the way down.” In the general sense, this is just the function of human panic. There are more complex explanations that have to do with investor utility and ratio of buyers to sellers in the different stages. That is beyond the scope of this writing.
I have the 3 year moving average displayed or the 36 month MA. Stan Weinstein used the 30 weekly on the weekly chart. A 30-40 MA is a good general signal for change in stage. Though, keep in mind, you do get head fakes. It helps to have a few indicators.
Q: How do I know what stage we are in?
A: look at the charts silly!
Actually, that’s only half true. The truth is, we can do this analysis with 100% accuracy IN THE PAST. In the present we only see half of the picture (the recent past). With that in mind, we need to gather some technical indicators in our trade/investment plan to help us confirm a change in investor paradigm. That’s where the real work begins for you as an trader/investor. Fortunately, there are tried and true suggestions.
Researching Advanced Market Indicators in Stage Analysis
See the Wyckoff method for testing accumulations and distributions
See Summary of Stan Weinstein's method for Stage identification
Stan Weinstein’s Secrets for Profiting in Bull and Bear Markets
NorthStarBadCharts very affordable subscription service (use discount code = stage to get 50% off!)
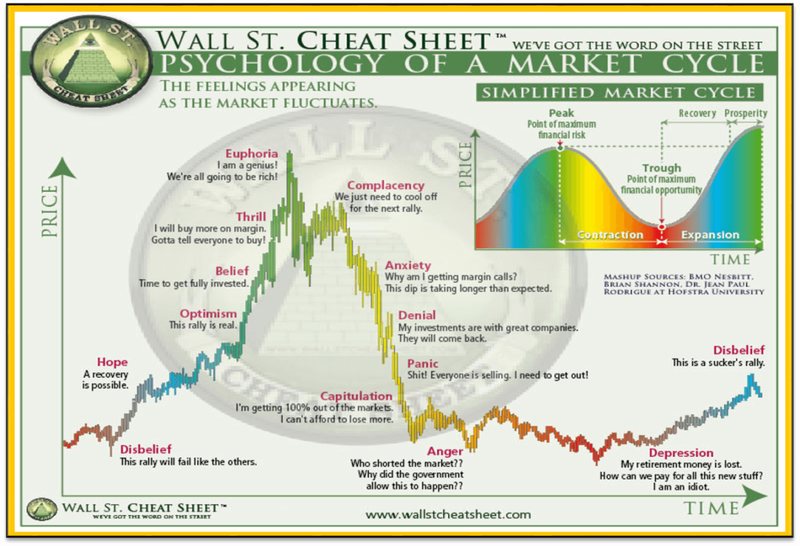
Investor Psychology of Market Cycles
The following cheat sheet can give you an idea of what kind of sentiment/rhetoric is in the marketplace (news) during different stages of the market cycle. These act more as “soft” indicators to judge the broad markets that are widely reported on.
What Stage is the Broad Market in Today?
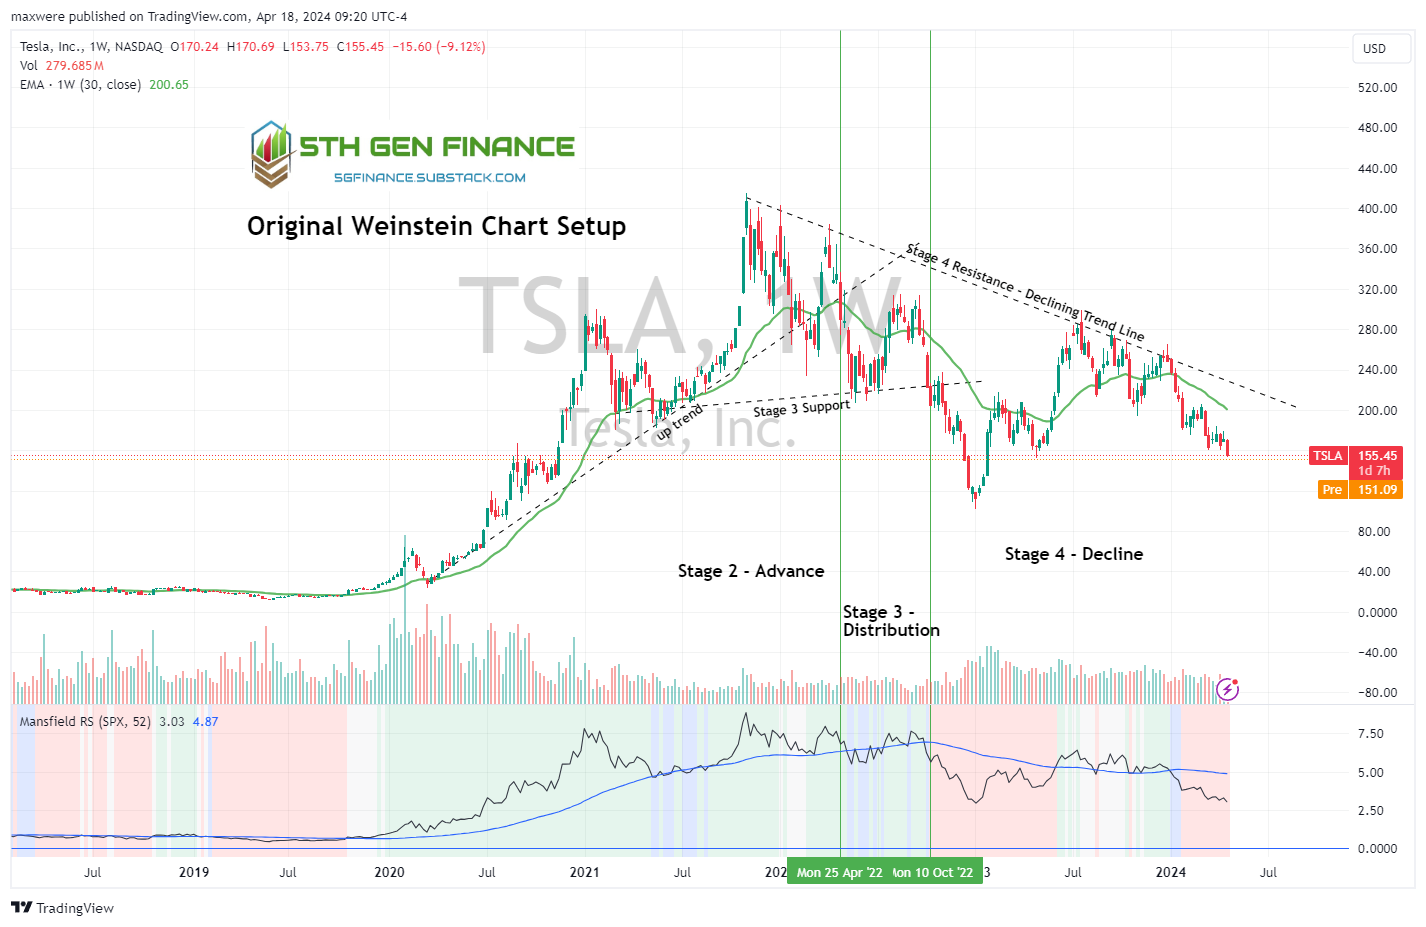
Tesla is cleary in stage 4. This is the proverbial “falling knife”.
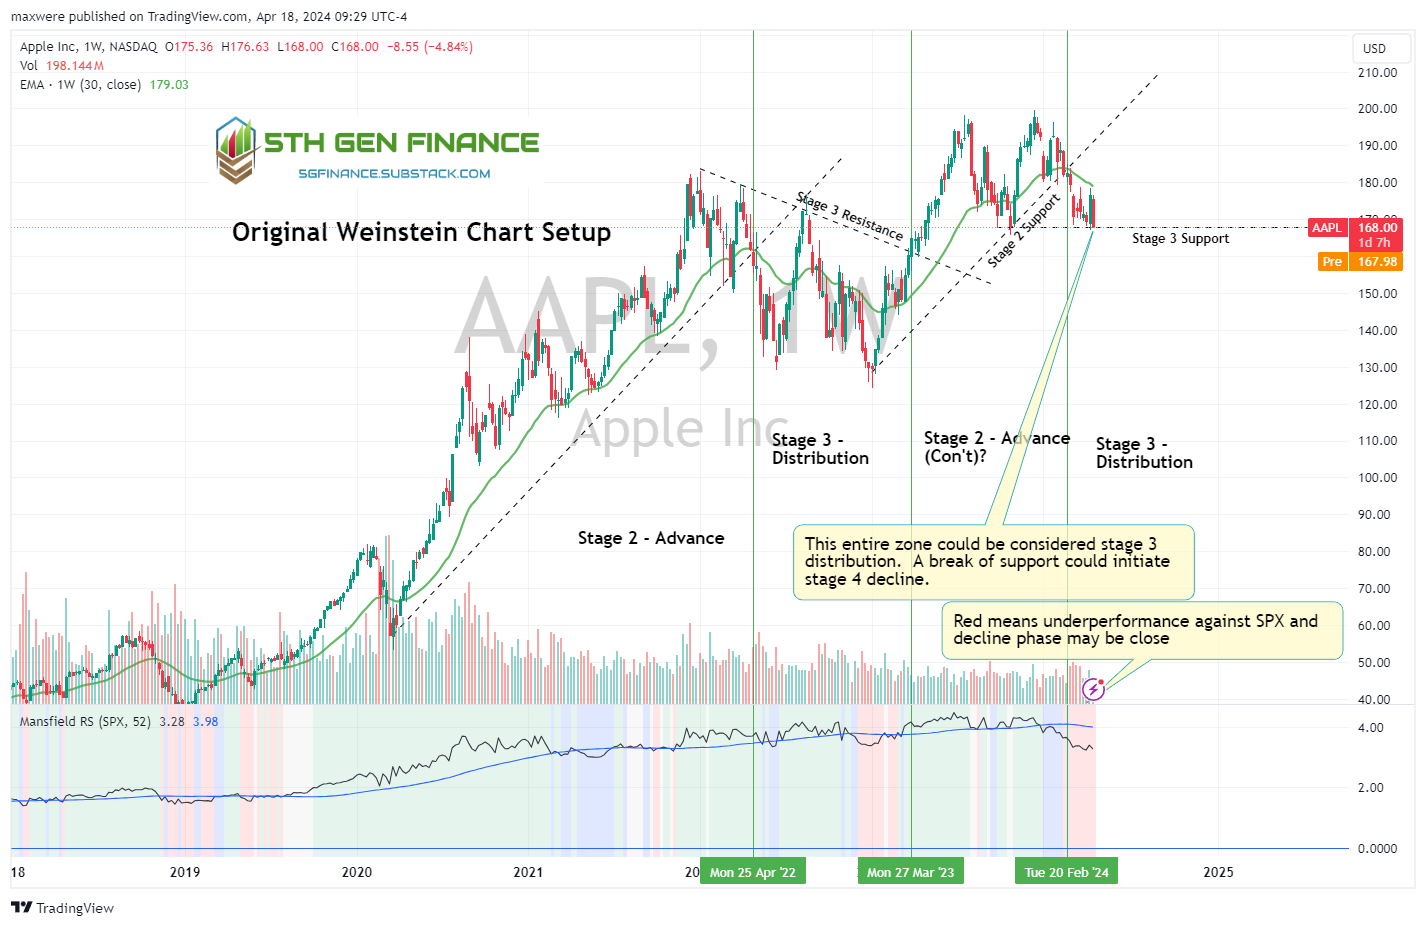
Apple is possibly flirting with stage 4 in this image. This is definately not a long entry (unless you like losing money).
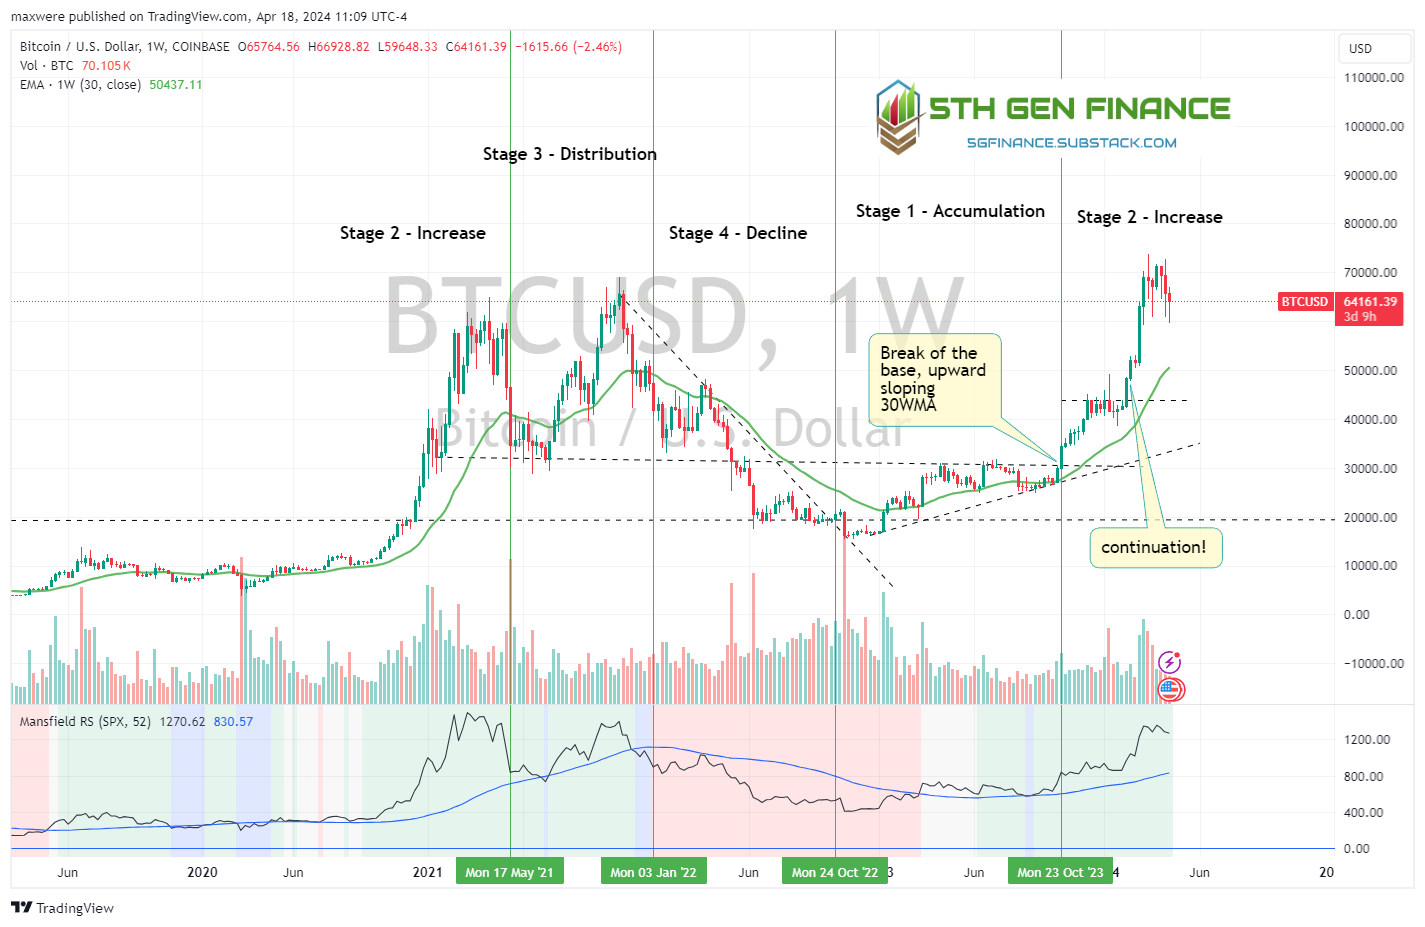
Bitcoin is in a stage 2 in this chart. There is some doubt as to its continuation from here.
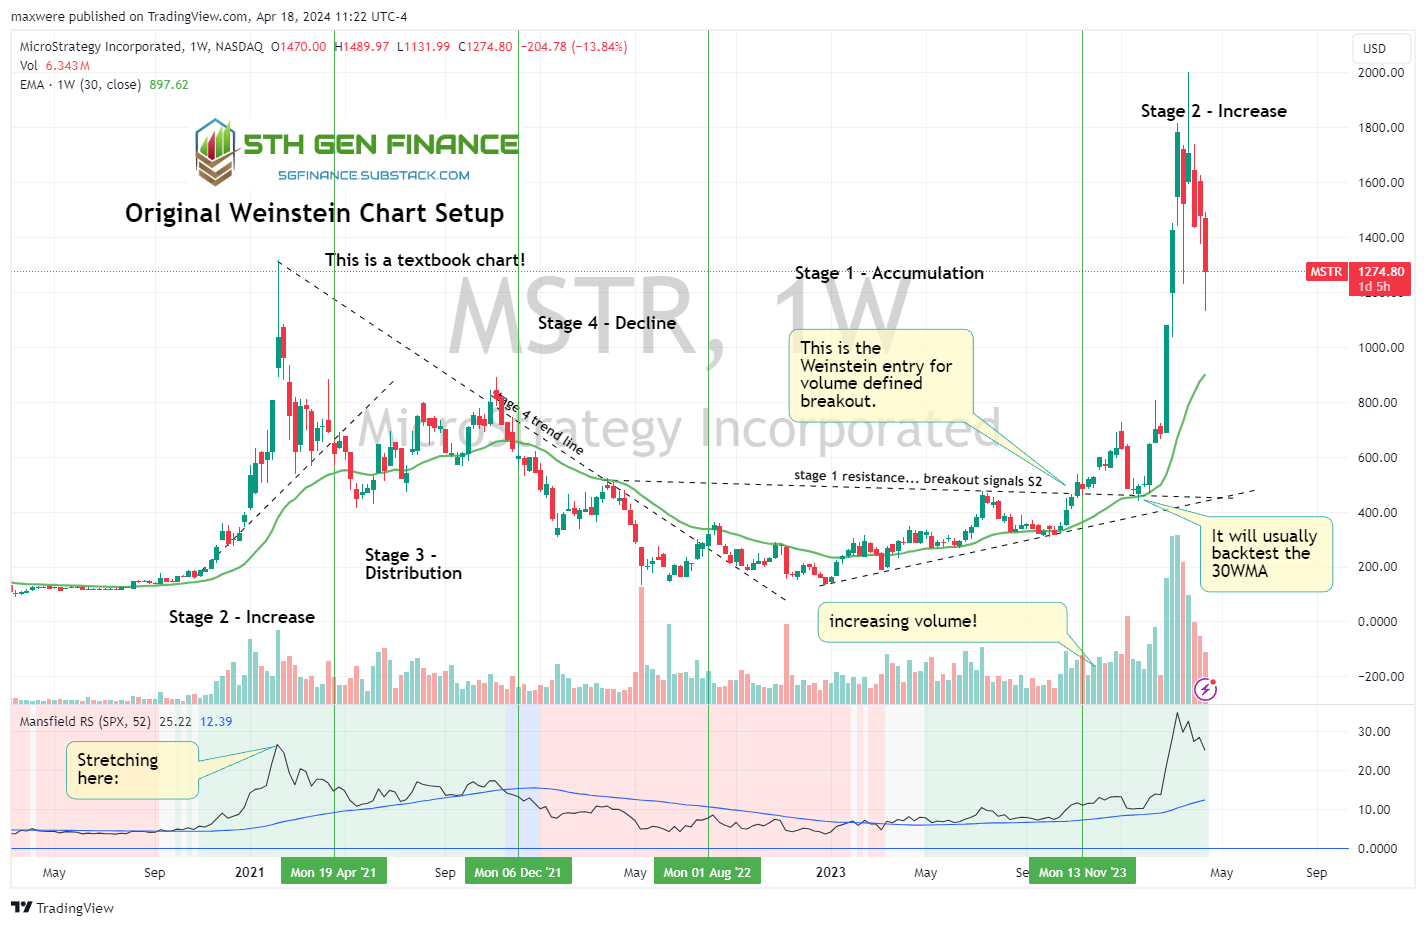
MSTR is a clean example of the Weinstein stage 1 breakout.
upward sloping 30WMA
volume defined breakout
outperformance of the S&P
nearly horizontal resistance
upward sloping support (higher lows put in)
backtest of the 30WMA
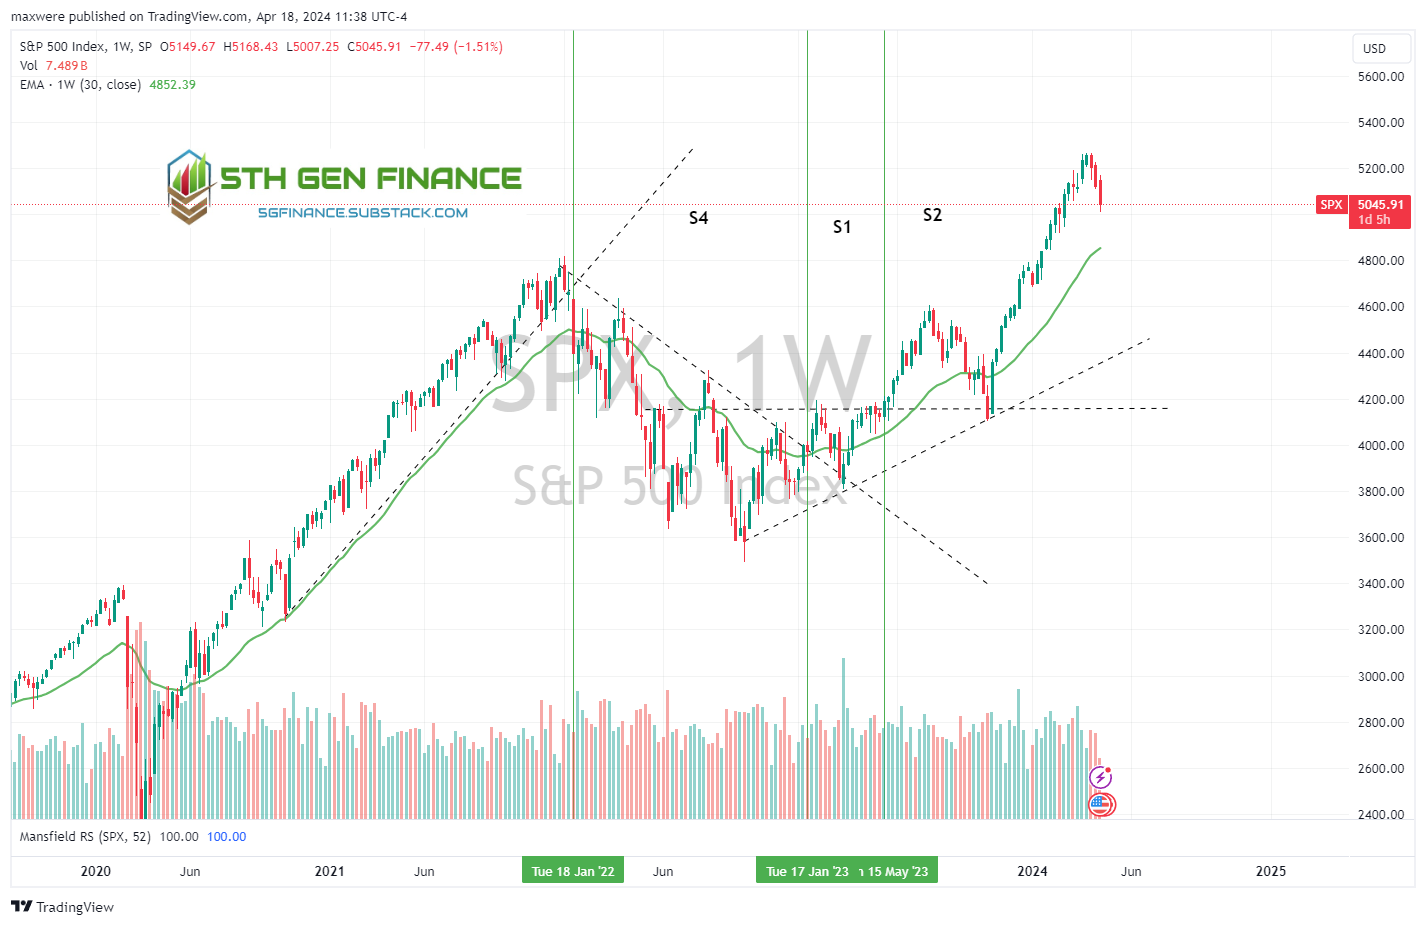
S&P looks to possibly be in the late 2nd stage of its move. This chart alone hasn’t yet given indication on the weekly timeframe that the pullback is more than a dip.
Details on this classic chart setup can be found in Stan Weinsteins book:
All models are wrong, some are useful…
Usage
Ultimately, I want to see the stage analysis model come into confluence with other fundamental models that suggest opportunity via value dislocation. This certainly isn’t required to place a trade, but the more model evidence in confluence, the more confident I can be with position size and patience in the investment. Other models include:
Discounted Cash Flow - The “Buffett” model. Standard approach for consistent large cap valuations.
Sum of the Parts - Net Present Value (NPV) of the Forward Strip (I call this the Rick Rule model). This is from the manual of valuation of mining and minerals provided with Ricks comments on his approach and back-testing against the work of some of this proteges. The model is best suited for small caps and mining companies with 3 projects or less.
Black-Scholes Real Optionality Model (in development) - based on an idea from the valuation of mining and minerals. I have some work to do on this one, but it will be appropriate for exploration and out-of-the-money business ventures. According to Nassim Taleb (Skin in the Game), the cheapest options (often free) are the embedded ones inside of a business (real options). The market overlooks these since they are not obvious to the retail screen. A more detailed analysis of leverage and convexity should offer better understanding of the internal risk/reward offered by highly assymetric companies.
Optionality can be found everywhere if you know how to look - Nassim Taleb
Fundamental Confluence
Stage 1 - Typically stocks in stage 1 should demonstrate some potential for price appreciation in its published fundamentals. In many cases the DCF model should suggest a value discount in terms of price. This is extra evidence. Keep in mind, if its someone else’s work, then its someone else’s assumptions. Make sure you understand the inputs in play. Stage 1 is often the longest stage. Does this company make money and pay a dividend? If the answer is yes, that means it is “accretive”. Accretive investments are growing and profitable. They should either compensate you for holding them or reinvest capital to further grow the business. Accretive investements can be attractive in stage 1 if you have patience as an investor. If the answer is no, then the company could be “dilutive”. A dilutive company will need to take on more debt and possibly dilute stock to continue its operation. These companies are high risk of running out of cash in stage 1. They are best avoided until a clear stage 2 has been defined and money is available to fund the capital investment. Tread wisely.
Stage 2 - Markets often overshoot price relative to specific stock fundamentals, but price fundamental fair value often overlap with technical levels. Development of multiple targets can be very helpful. Professional speculators are going to take half or more of their investment off the table when sane valuations come into equilibrium with market price on the screen. Extended targets can help capture momentum moves, but you should never be “all in” to ride the blow off. At its peak TSLA’s market price was suggesting it would grow its cash flows by 10-20x. This was completely unrealistic and became apparent to the market once viable competitors showed up and took market share. Develop your price targets early in the move and stay disciplined with profit taking.
Stage 3 - Be wary of this stage. Walter and the institutional investors need buyers to unload their positions. They are very effective and selling you (the retailer) on the narrative as a buyer. Typically, ignorance and greed are the tools to create an intoxicating mix for the “buy the top” sucker. Don’t be a sucker. FA tools are a great way gain additional confirmation that the end is near and not get faked out by propaganda.
Stage 4 - The inverse of stage 2. DCF and fundamental models should indicate overpriced or equal priced at this stage. Just like stage 2, the market reaction is bound to over react and create deep discounts. Unless you are a capable “short” trader, stay away.


