


Credit Crisis in Early 2025? Who will be the Gilt-y Party?
The global bond market may be signaling a major move to the downside.

This week’s closing candles may be the first technical indication of a move to much higher yields. I should caveat, it’s only a confirmed WEEKLY breakout on these. Credit markets move much slower and with more profound consequences. But, in my opinion we need to keep a close eye on the bond market over the next weeks and months.
If a crash, the “Gilty” party…

The UK Gilt market experienced a significant price breakdown this week. The technical measured move is nearly 25% drop in equity. What are the implications for such a move to UK banks?

The pound is confirming bearishness in the markets…

What are the implications with yields? From a purely technical perspective + 250bps seems highly plausible. This would surely wreck the British economy perhaps worse. We are told Bank of England has liquidity in place. Anything less than direct buying of the long end of the curve won’t stop this train in my opinion. But, as we saw during the 2022 crisis, that is exactly what happened.

UK Credit spreads
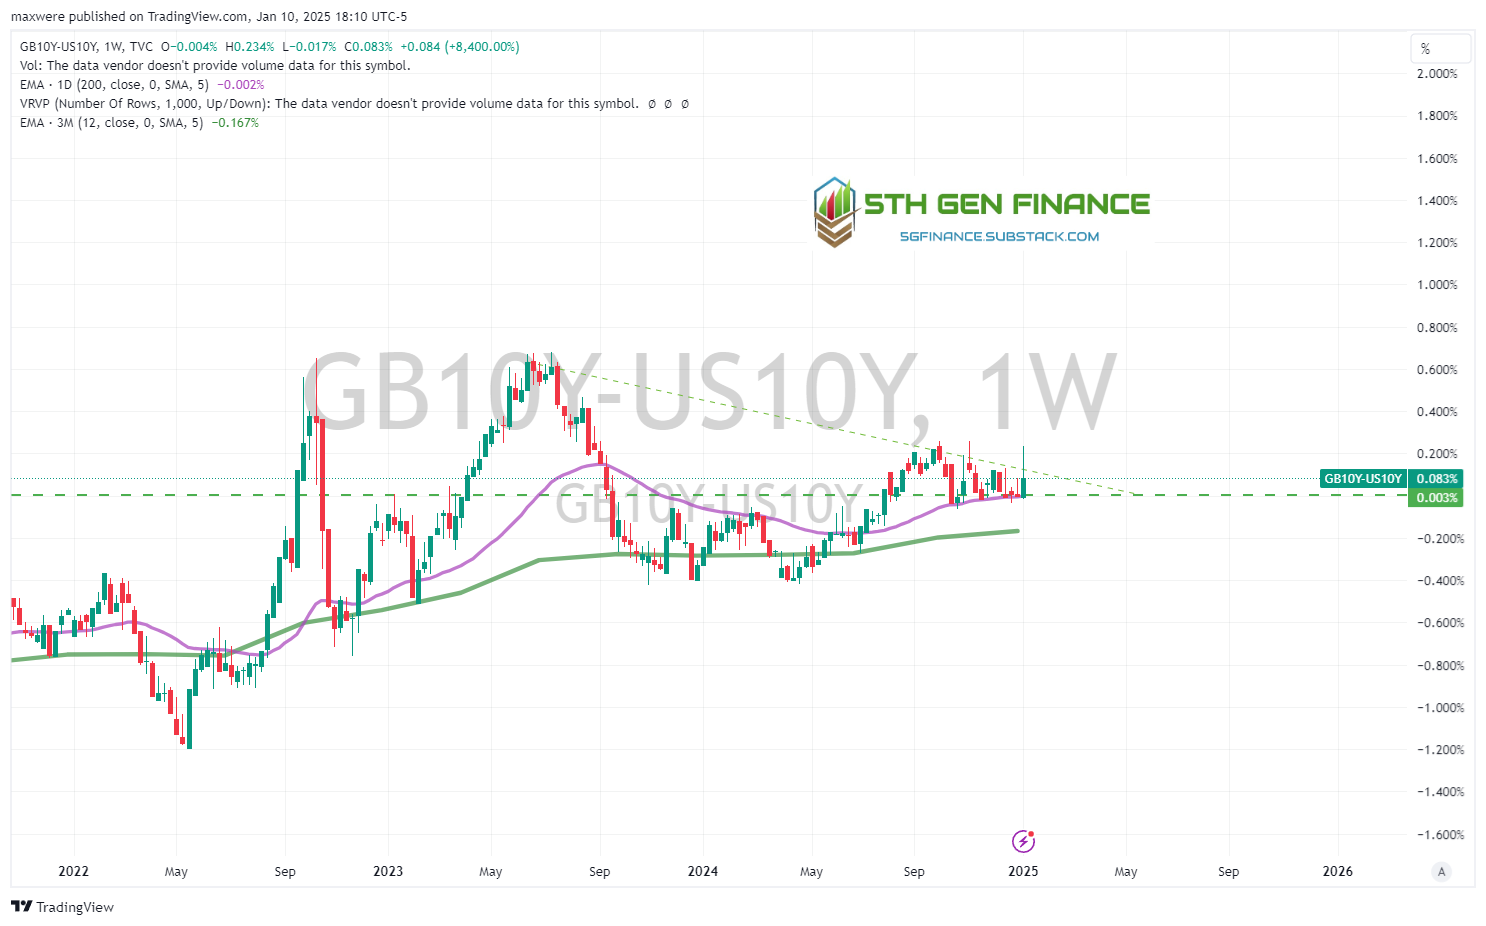
If things do come unglued, look for widening spreads against the US10Y. This week saw a rejection candle against the trend line. The squeeze is as clear as day, and these type of patterns usually resolve to the upside. 60-80bps spread could be trouble, especially when we look at the US10Y prospects.
In my piece published earlier mid last year I discussed the setup as second wave demand pull inflation. This forecast is very much in play.
The Coming The Second Wave - Demand Pull Inflation

With old inflation riding the headlines, I have read till I am bleary-eyed, and I can't get head from tails of the whole thing. ... Now we are living in an age of explanations-and plenty of 'em, too-but no two things that's been done to us have been explained twice the same way, by even the same man. It's and age of in one ear and out the other. - Will …

This chart published last year, has added and broken out of a bull flag channel pattern. The long-term technical projection of this move is around 400bps! 8-9% yields on the US 10 year. That could equate to double digits in the European markets considering a wider credit spread.
If there is a perceived risk of default on any of the major government securities spreads will widen against the US treasury market.
Keep an eye on spreads!
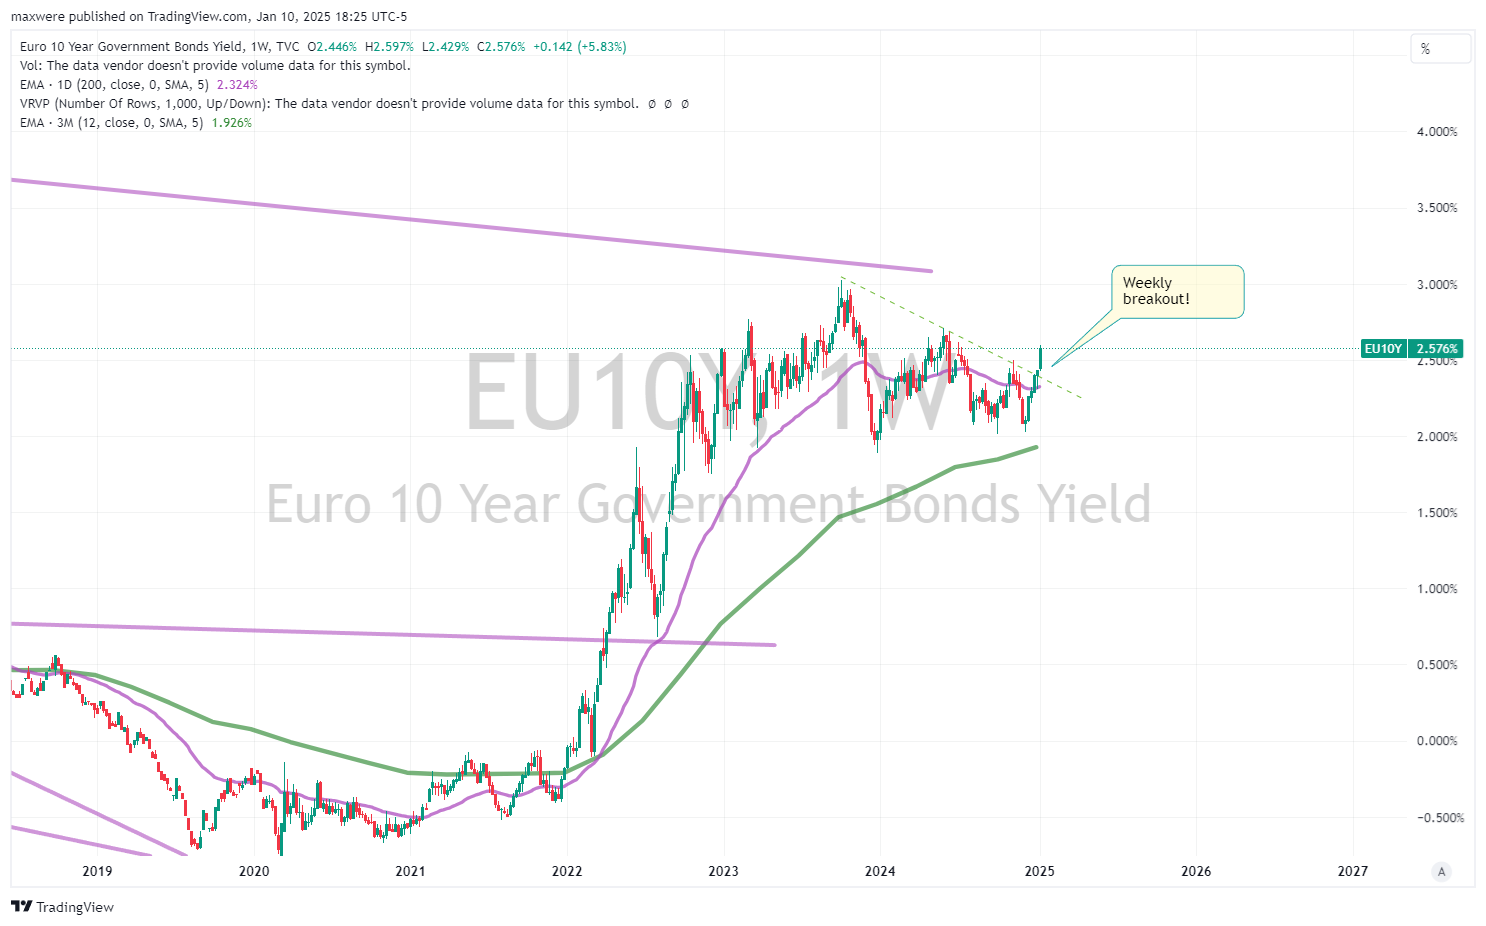
Euro and Continental markets
Triangles in the continental markets. Reflective of what is going on with US treasuries as well.


Japanese Bonds
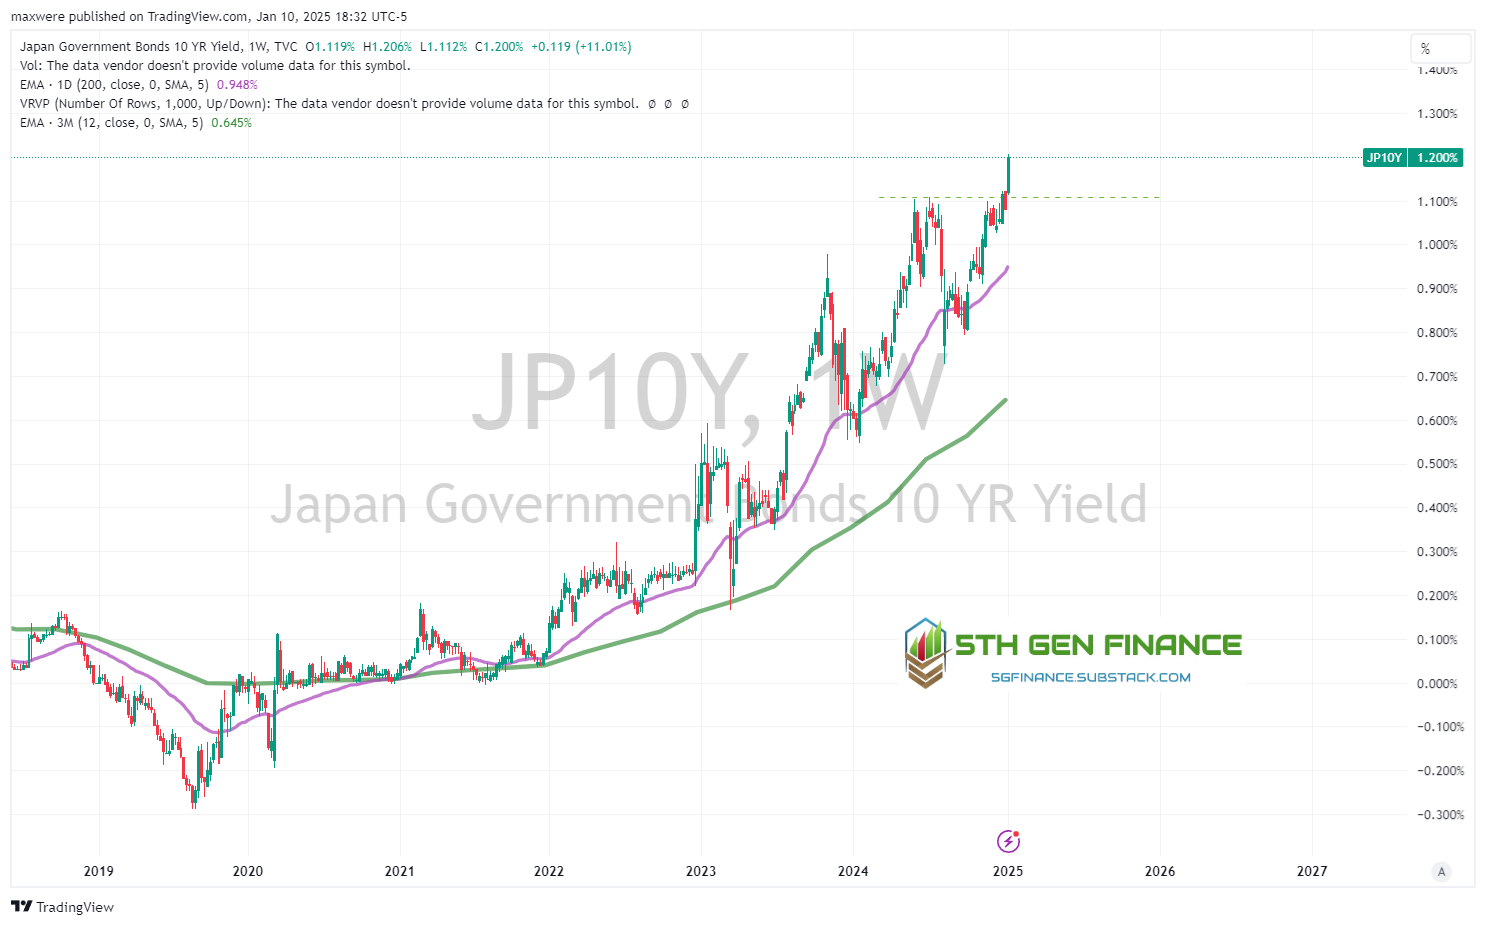
There is no mistaking this chart for anything but a parabolic move. Much of what we are seeing is the tightening away from yield curve control by the BOJ to save the Yen.

The USD is making a run to breakout against the Yen again. Clearing 162 is a level to watch.
Conclusion & Market Implications
What are the implications to hard money, commodities, energy and the other current “value” plays?
Dollar & US MM - positive. US Dollar is still considered the safe currency. We are likely to continue to see a rise in the DXY.
Precious Metals - positive. PMs are the desired risk of asset.
Oil, gas and conventional energy - positive due to inflationary implications
Uranium and emerging energy - not terribly affected. Additional volatility is likely, but the bullish fundamental conditions of Uranium are overriding factors. Wind and Solar I have concerns.
Crypto - make no mistake, deleveraging is not good for speculative financial assets. Bullish bitcoin dominance, bearish the sector.
Tech - very bearish. Maintain margins will tighten. Short-term lending. This is a deleveraging event.
Broad markets - bearish. Conventional indexes will experience rotation to risk off assets.
Bond markets - bearish. Ordinarily the 10yr UST is the place to be in a liquidity event. But the luster isn’t high considering its the bond markets themselves that could be under pressure. Hold to maturity and roll/ladder or money market.